
Mills detects issues across your whole system, investigates so only real issues reach you, and hands you the fix, without adding noise.
Know of problems before your customers do
Mills watches every component across metrics, logs, events, and traces - without the noise or blind spots
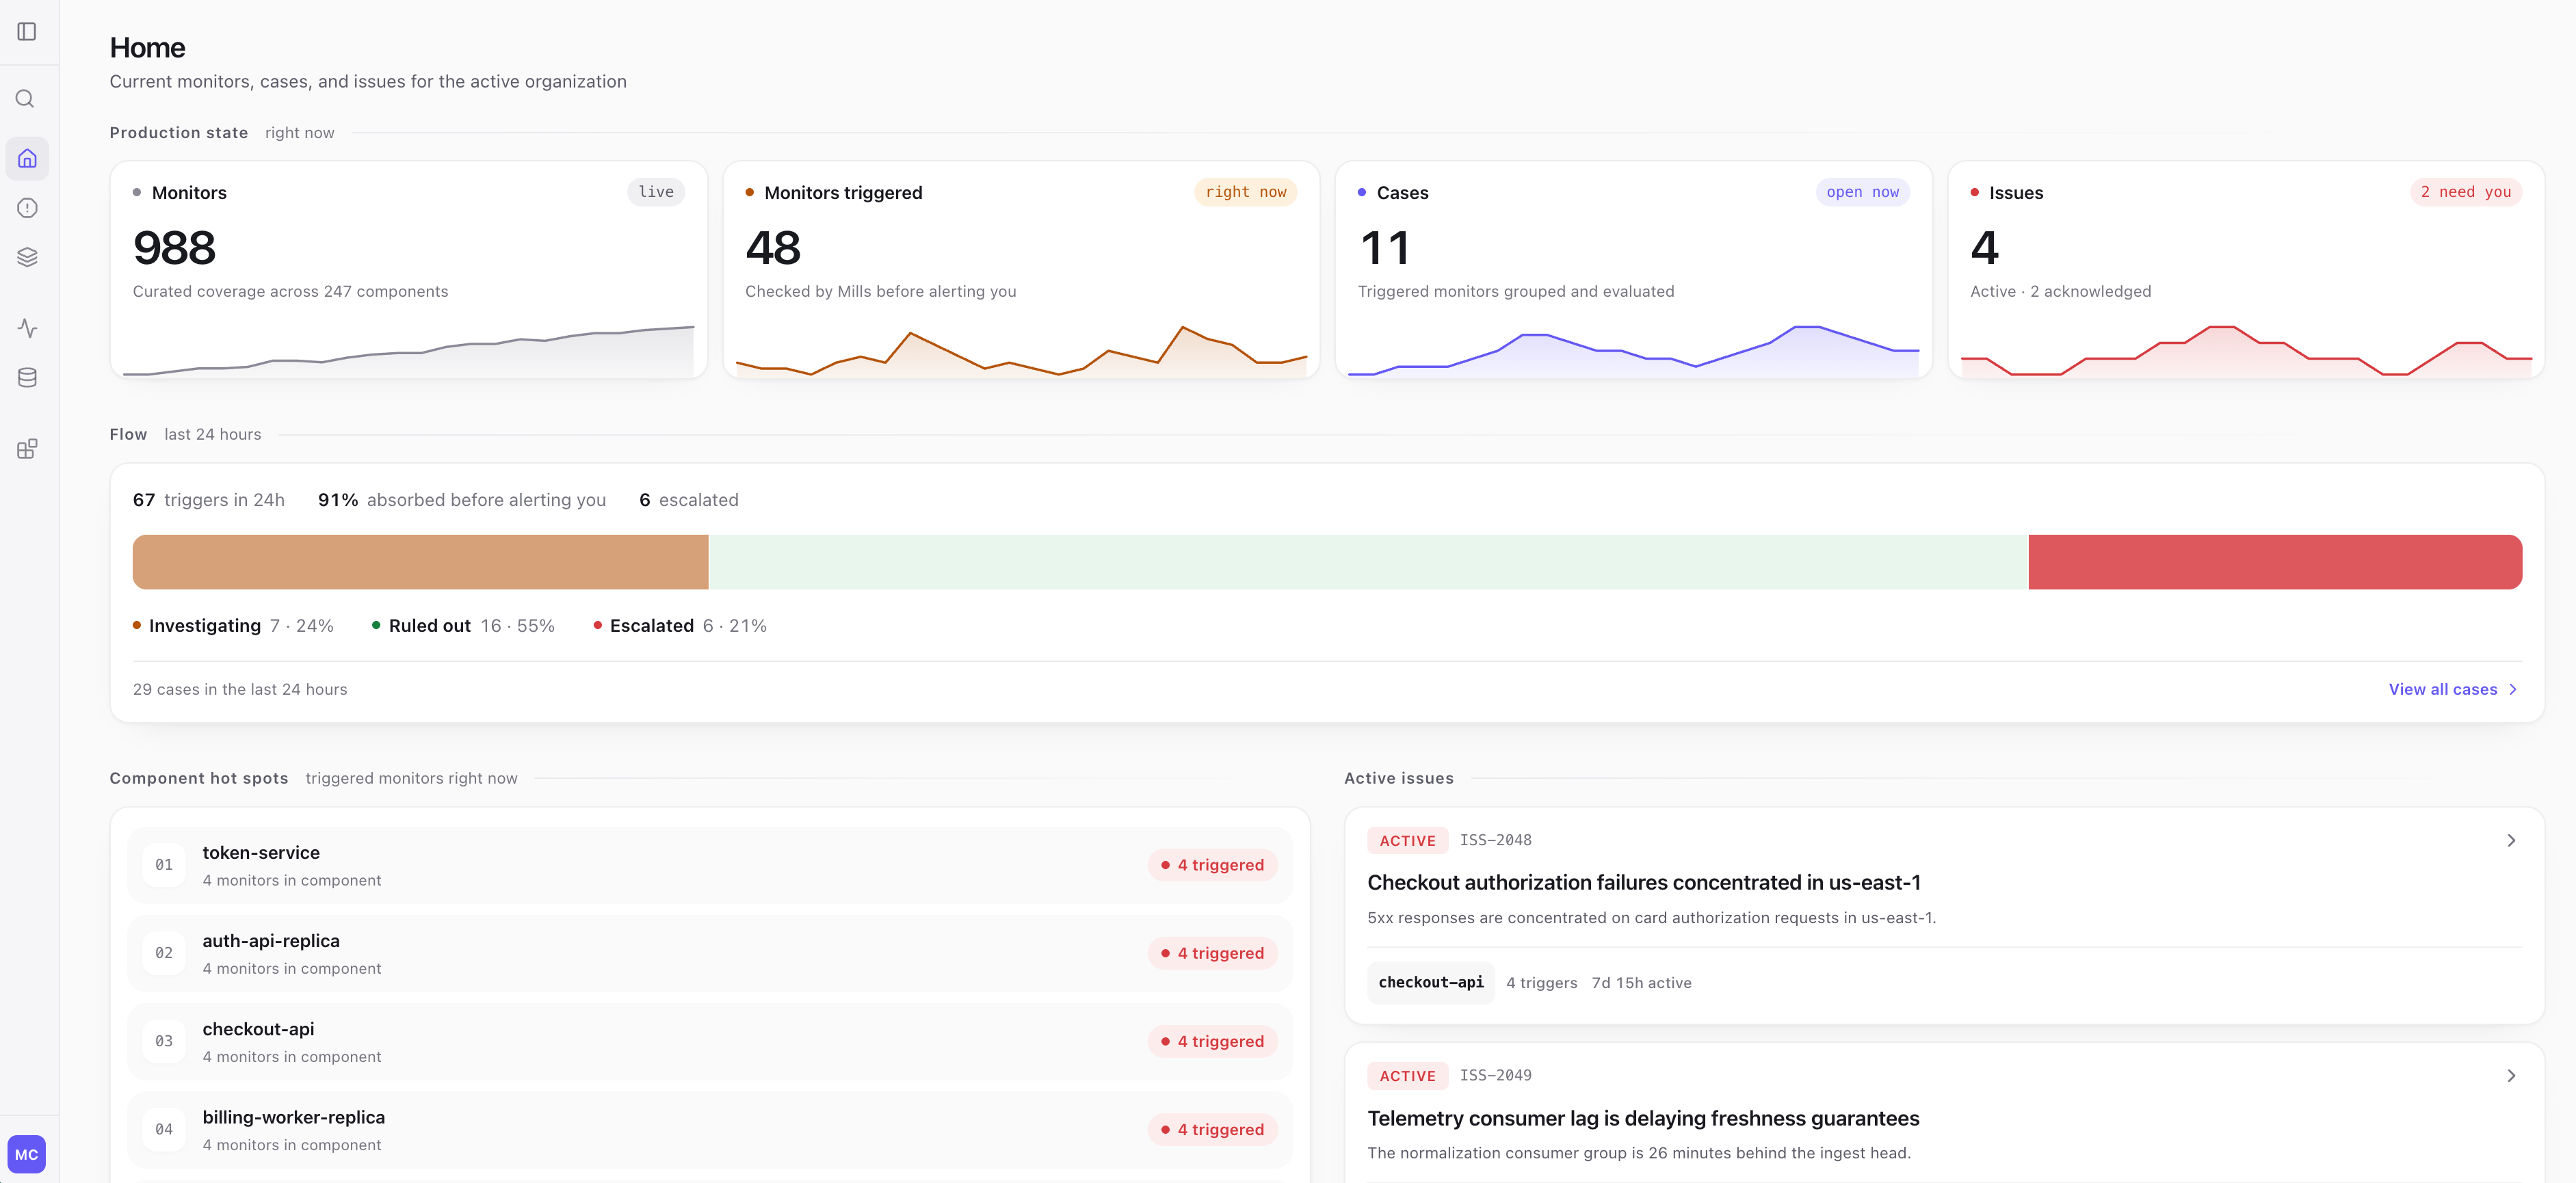
The whole surface, watched
Every service, database, and dependency gets its own monitors, generated from a living map of your system.
Sensitive — without alerting you
Monitors are broad and sensitive on purpose — and none of it reaches your team. Only verified cases become an alert
Blind spots, hunted down
Mills audits its coverage against your topology, finds what isn't watched, and closes the gap itself.
Not just the pager-worthy
Slow regressions, stalled jobs, queues that keep growing. Nobody writes a threshold for those, so nobody sees them. Mills reports them at their real severity.
Nobody sets the dial anymore
Mills writes its own monitors and recalibrates them as your system changes. No thresholds to pick, no monitors to maintain, no quarterly pass to turn the noise down and the coverage back up.
Nothing to pick
Every threshold is written & calibrated from the component and it's telemetry, not from a number someone guessed.
Nothing to re-tune
As traffic, topology, and release cadence change, the thresholds move with them.
Nothing to trade off
Sensitivity costs you nothing, because monitors never reaches your team unverified.
Issues investigates before interrupting your team
Broad, sensitive monitors would bury a human in noise - so no human sees it. The agent does the triage, and your team is alerted only when an issue is verified and important.

Every signal investigated
Triggered monitors are grouped into cases — and every case is qualified based on observed facts.

A verifier gates every alert
Before a case escalates, Mills rechecks the evidence and rules out false positives.

Deliberately not alerting
Most cases are watched, correlated, and ruled out behind the scenes. That's a decision the agent makes
 Investigation
A stale JWKS cache on one verifier pool best explains the regional concentration of verification failures.
4 monitors cover the same production service (token-service), triggered within four minutes, and use overlapping five-minute windows. Their error-budget, latency, 5xx-rate, and saturation readings moved at the same onset.
Customer impact is not confirmed from observability telemetry alone.
 What we observed
Signature verification failures are clustered on one verifier pool and one cached key version.
3.1% of EU token-verification requests failed or retried during the observed window.
Datadog
 Triggered monitors
 Evidence timeline
Root cause, established
After a case escalates, the agent tests multiple hypotheses based on monitors and telemetry data, then adds the most likely root cause & evidence to the issue.
The investigation runs on whichever agent you point it at.
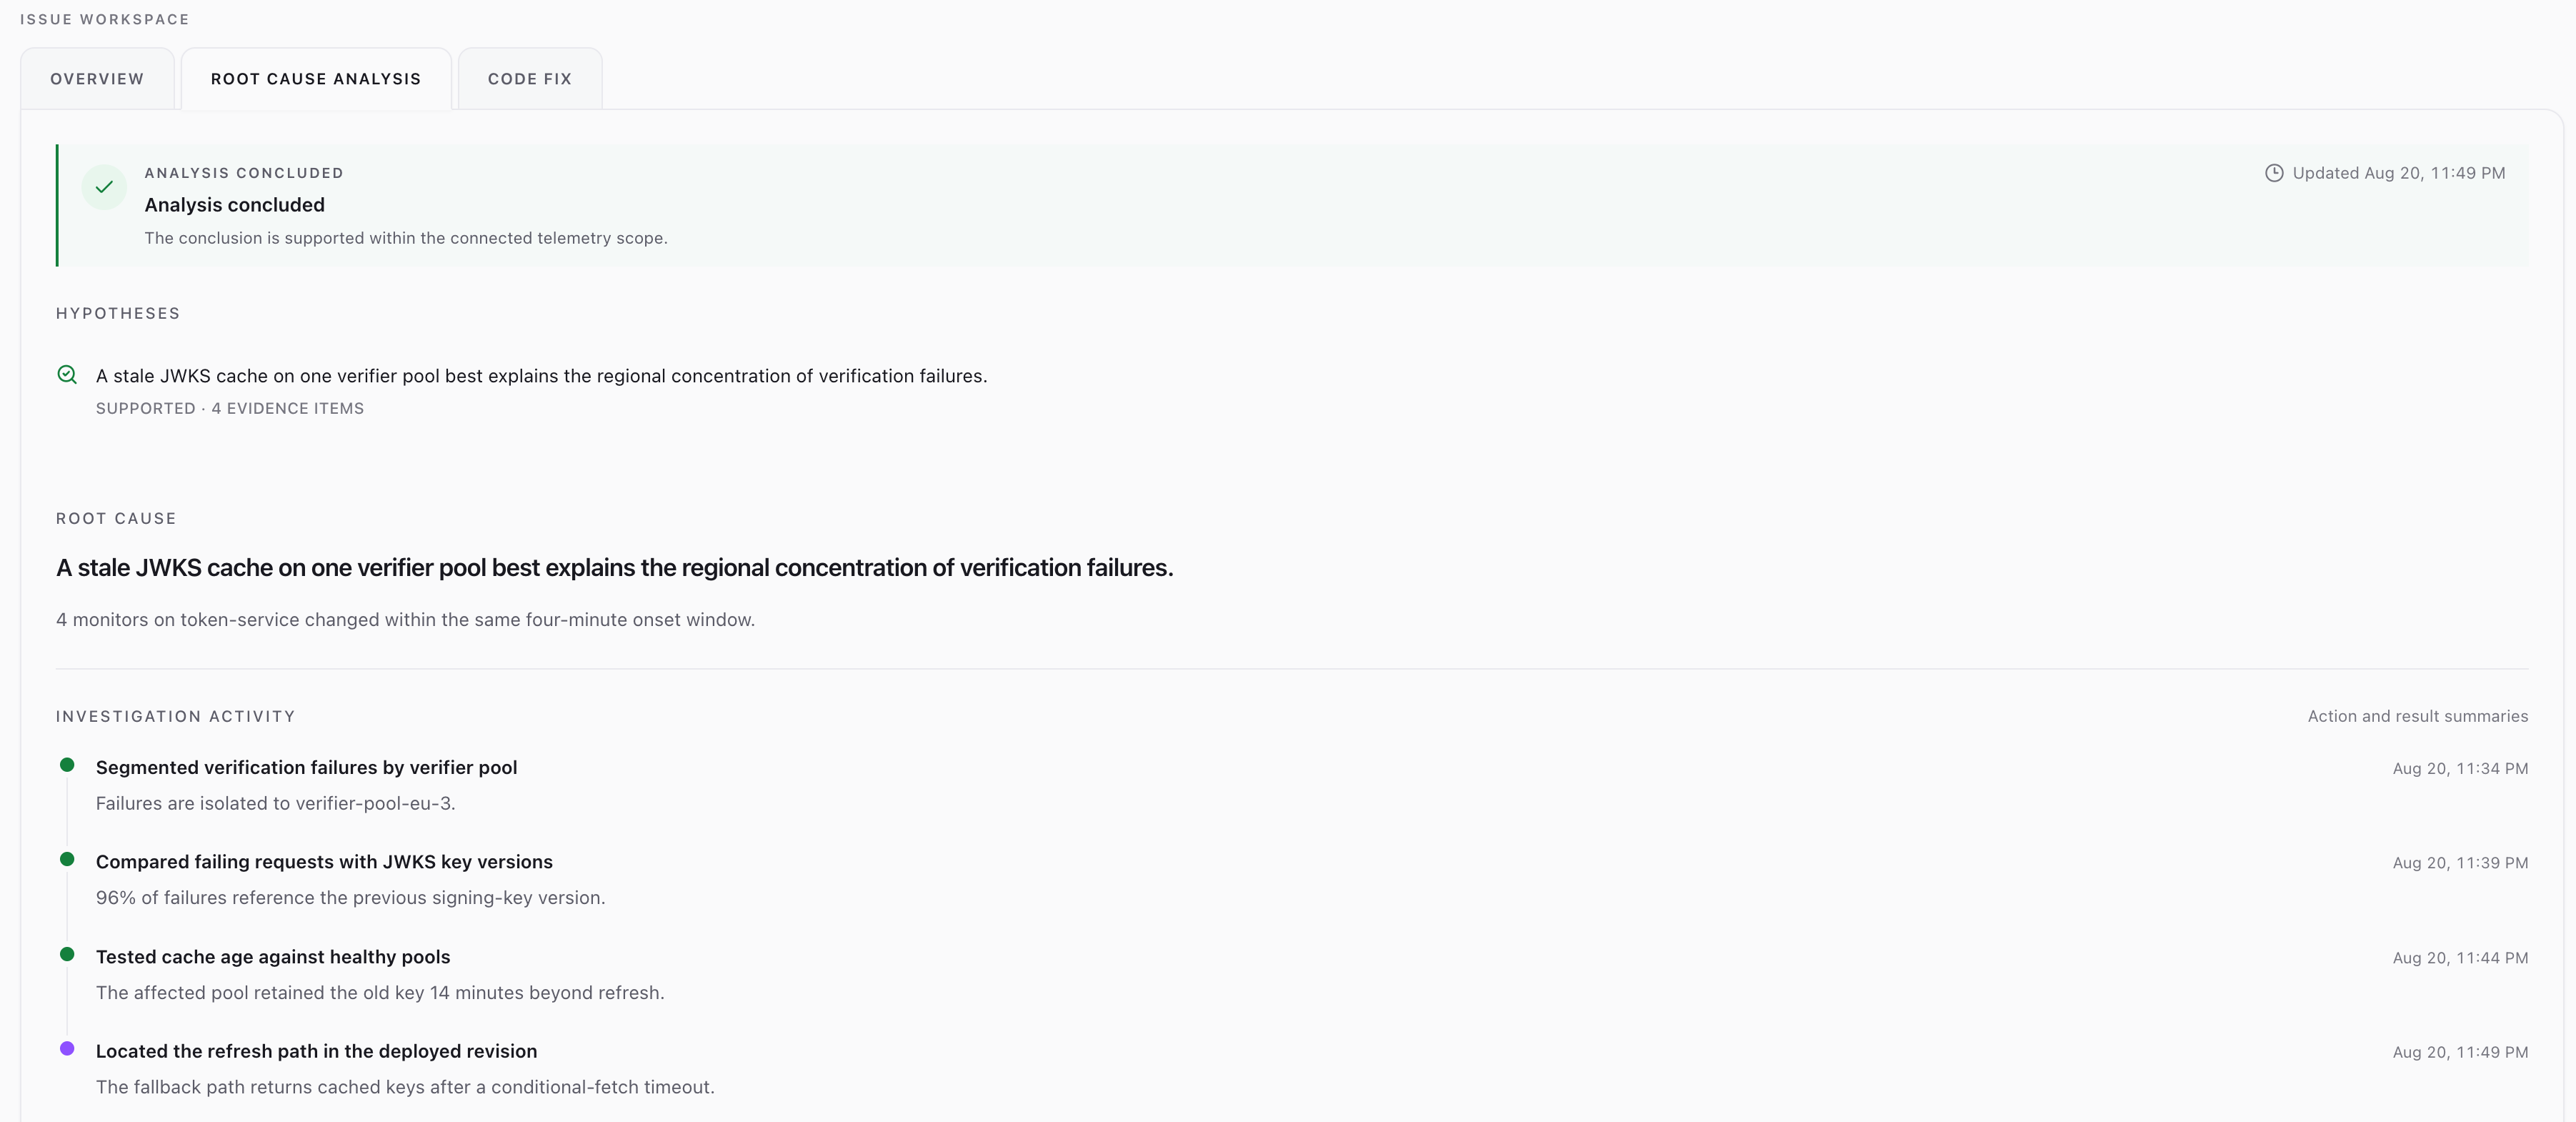
From a verified issue to a fix.
Once the root cause is clear, Mills finds the faulty code, recommends a fix, and hands your coding agent a complete, evidence-backed brief or opens a pull request for review.
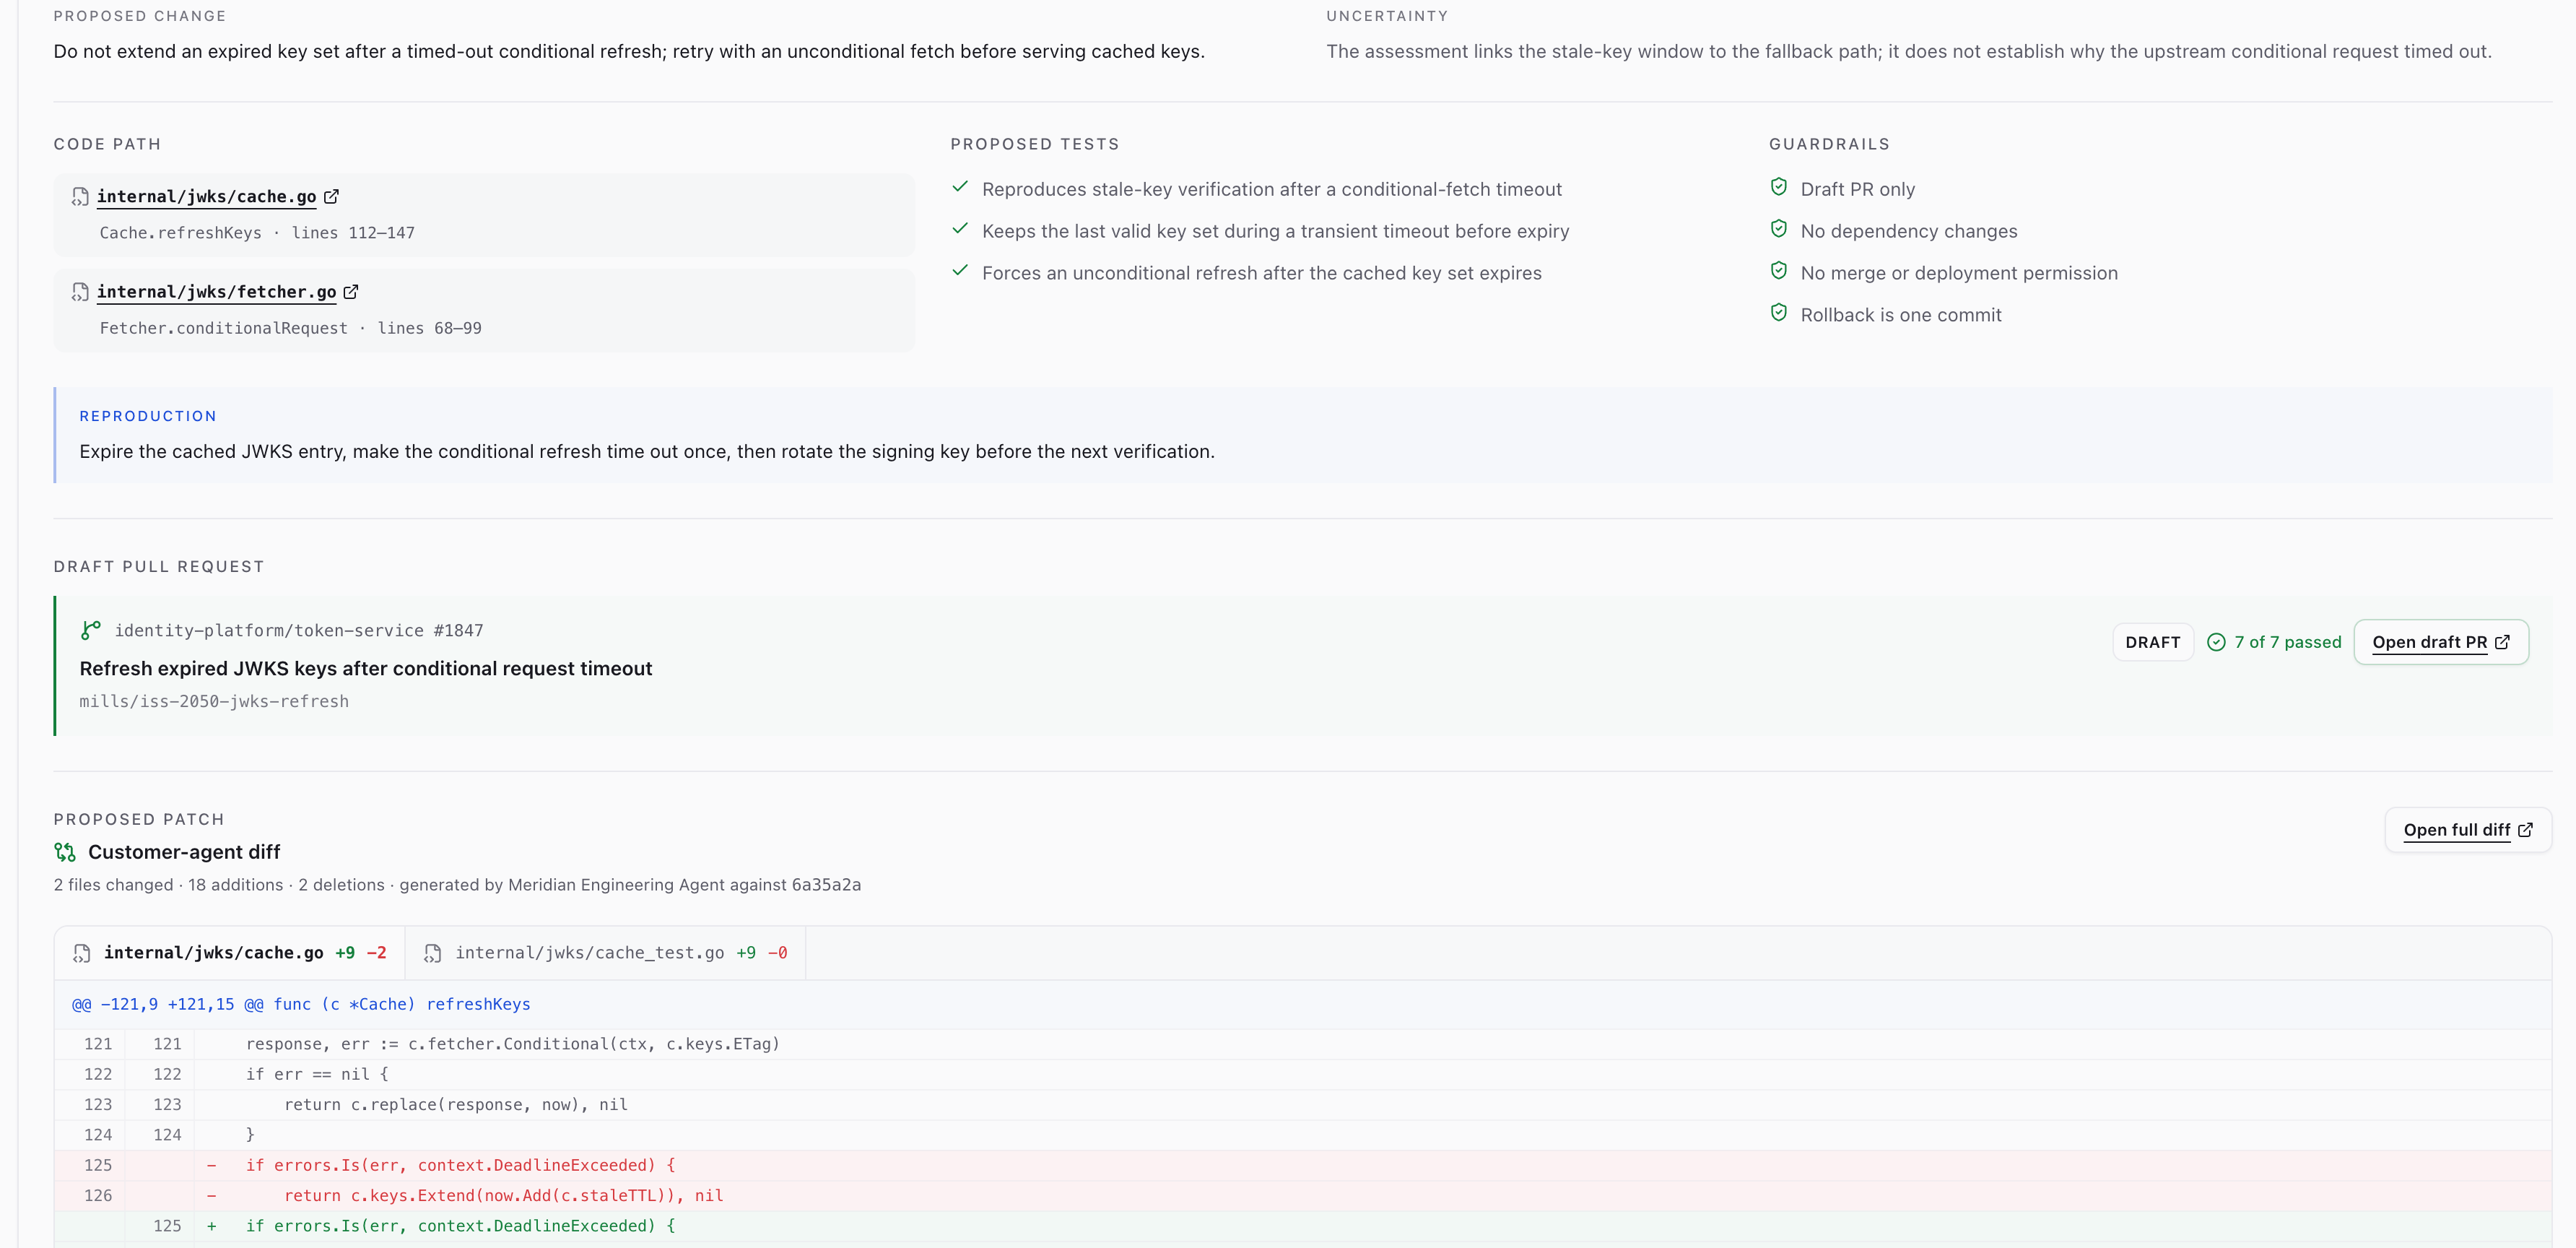
A good resolution requires perfecting every step
Five steps from a read-only connection to a fix in review.
Connect
Read-only access to the observability platform you already have. No code changes, no agents to deploy, no rip-and-replace.
Understand
Continuously builds a living map of your system, keeping it current as your environment changes.
Detect
Continuously watches metrics, logs, events, and traces - writing and calibrating its own monitors.
Investigate
Every monitor triggered is reviewed by an agent, not a human. only real issues reach you, with root cause attached.
Resolve
The recommended fix, with root cause attached goes to your coding agent as context, or Mills opens the pull request itself.